New in Brightback: Dashboard 2.0 & reporting logic updates


Insights from Brightback help you test, measure and act on all the reasons your customers cancel. Now, these insights go even deeper with two shiny new reports on our Dashboard and improved reporting logic across all Brightback Reports.
Dashboard updates
Previously, a breakdown of Cancel Page performance required working mathematical magic with CSV exports (or waiting for your success manager to wake up on the west coast). With the new Dashboard Reports, Save Performance and Deflection Funnel, you can easily monitor the overall performance of your Cancel Page and Downgrade Flow anytime with no math needed.
Save the day (and Saves by day)
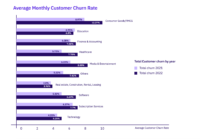
The Save Performance Report helps you monitor changes in your Save Rate over time. Check Save Performance after making changes in your Cancel Flow to assess impact and analyze results. Like all Brightback Reports, you can filter Save Performance by Segments to get insights into how Save Rates differ across Segments, like for high value vs. low value accounts.
The Save Performance Report plots the 30 day weighted average of the daily save rate for the time period selected. In other words, each day’s save rate represents the weighted average of the preceding 30 days worth of daily save rates, weighted based on each day’s volume.
View any day’s individual Save Rate by hovering over the plot point.

Deflect just a little bit
The Deflection Performance Report presents a breakdown of your Cancel Page performance by outcome, showing how many unique accounts visited your Cancel Page during a given time and what happened to them. A customer who doesn’t cancel is added to the Watch List after 30 minutes. From there, if the customer does not cancel after 30 days, they’re considered a save. Monitor overall save and cancel performance over time and filter by Segments to drilldown on which customers you’re most successfully deflecting.

Hover over any component in the Deflection Performance Report to receive a summary, including the number of accounts for the component and the rate for that outcome.

I see your logic…
In addition to the Dashboard updates, we’ve also spruced up the logic behind all of our reports, making calculations more consistent and more accurate. Notable changes include treating our Customers Page Reports like an Event Log and cleaning up duplicate cancels.
The main event log
The Customer's Page now presents an Event Log for Cancel Page outcomes. This means saved customers that subsequently cancel now show up in both the Saved and Canceled Customers Pages keeping things consistent with how we present data throughout the Brightback app. For more details on how Brightback Reports are calculated, check out our guide to reporting terms and definitions.
Don’t sync twice
We implemented an improvement to the way we de-dupe Cancel events per customer: the unique cancel period.
The unique cancel period is a defined amount of time after a Cancel event that filters duplicate visits by the same Customer to the Cancel Page, removing them from Reports. The unique cancel period is set to 60 days on accounts by default, but can be configured by contacting support@brightback.com.
For a more detailed overview of all Reporting logic updates, check out our Reporting Logic Updates Release Notes.